
GO-Science challenge
We're delighted to be helping the Government Office for Science (GO-Science) with a maths challenge for National Numeracy Day 2024.
Watch the video below for an introduction to the challenge by the Government Chief Scientific Adviser, Professor Dame Angela McLean, along with the full challenge text and the graphs. Whether it's a team effort with family, friends or colleagues, or you're tackling this on your own, we hope you enjoy having a go!
You can find the answers and links to follow-up resources here.
The graphs below show all the Olympic records set in four track and field Athletics events.
Can you work out which events are shown in the graphs?
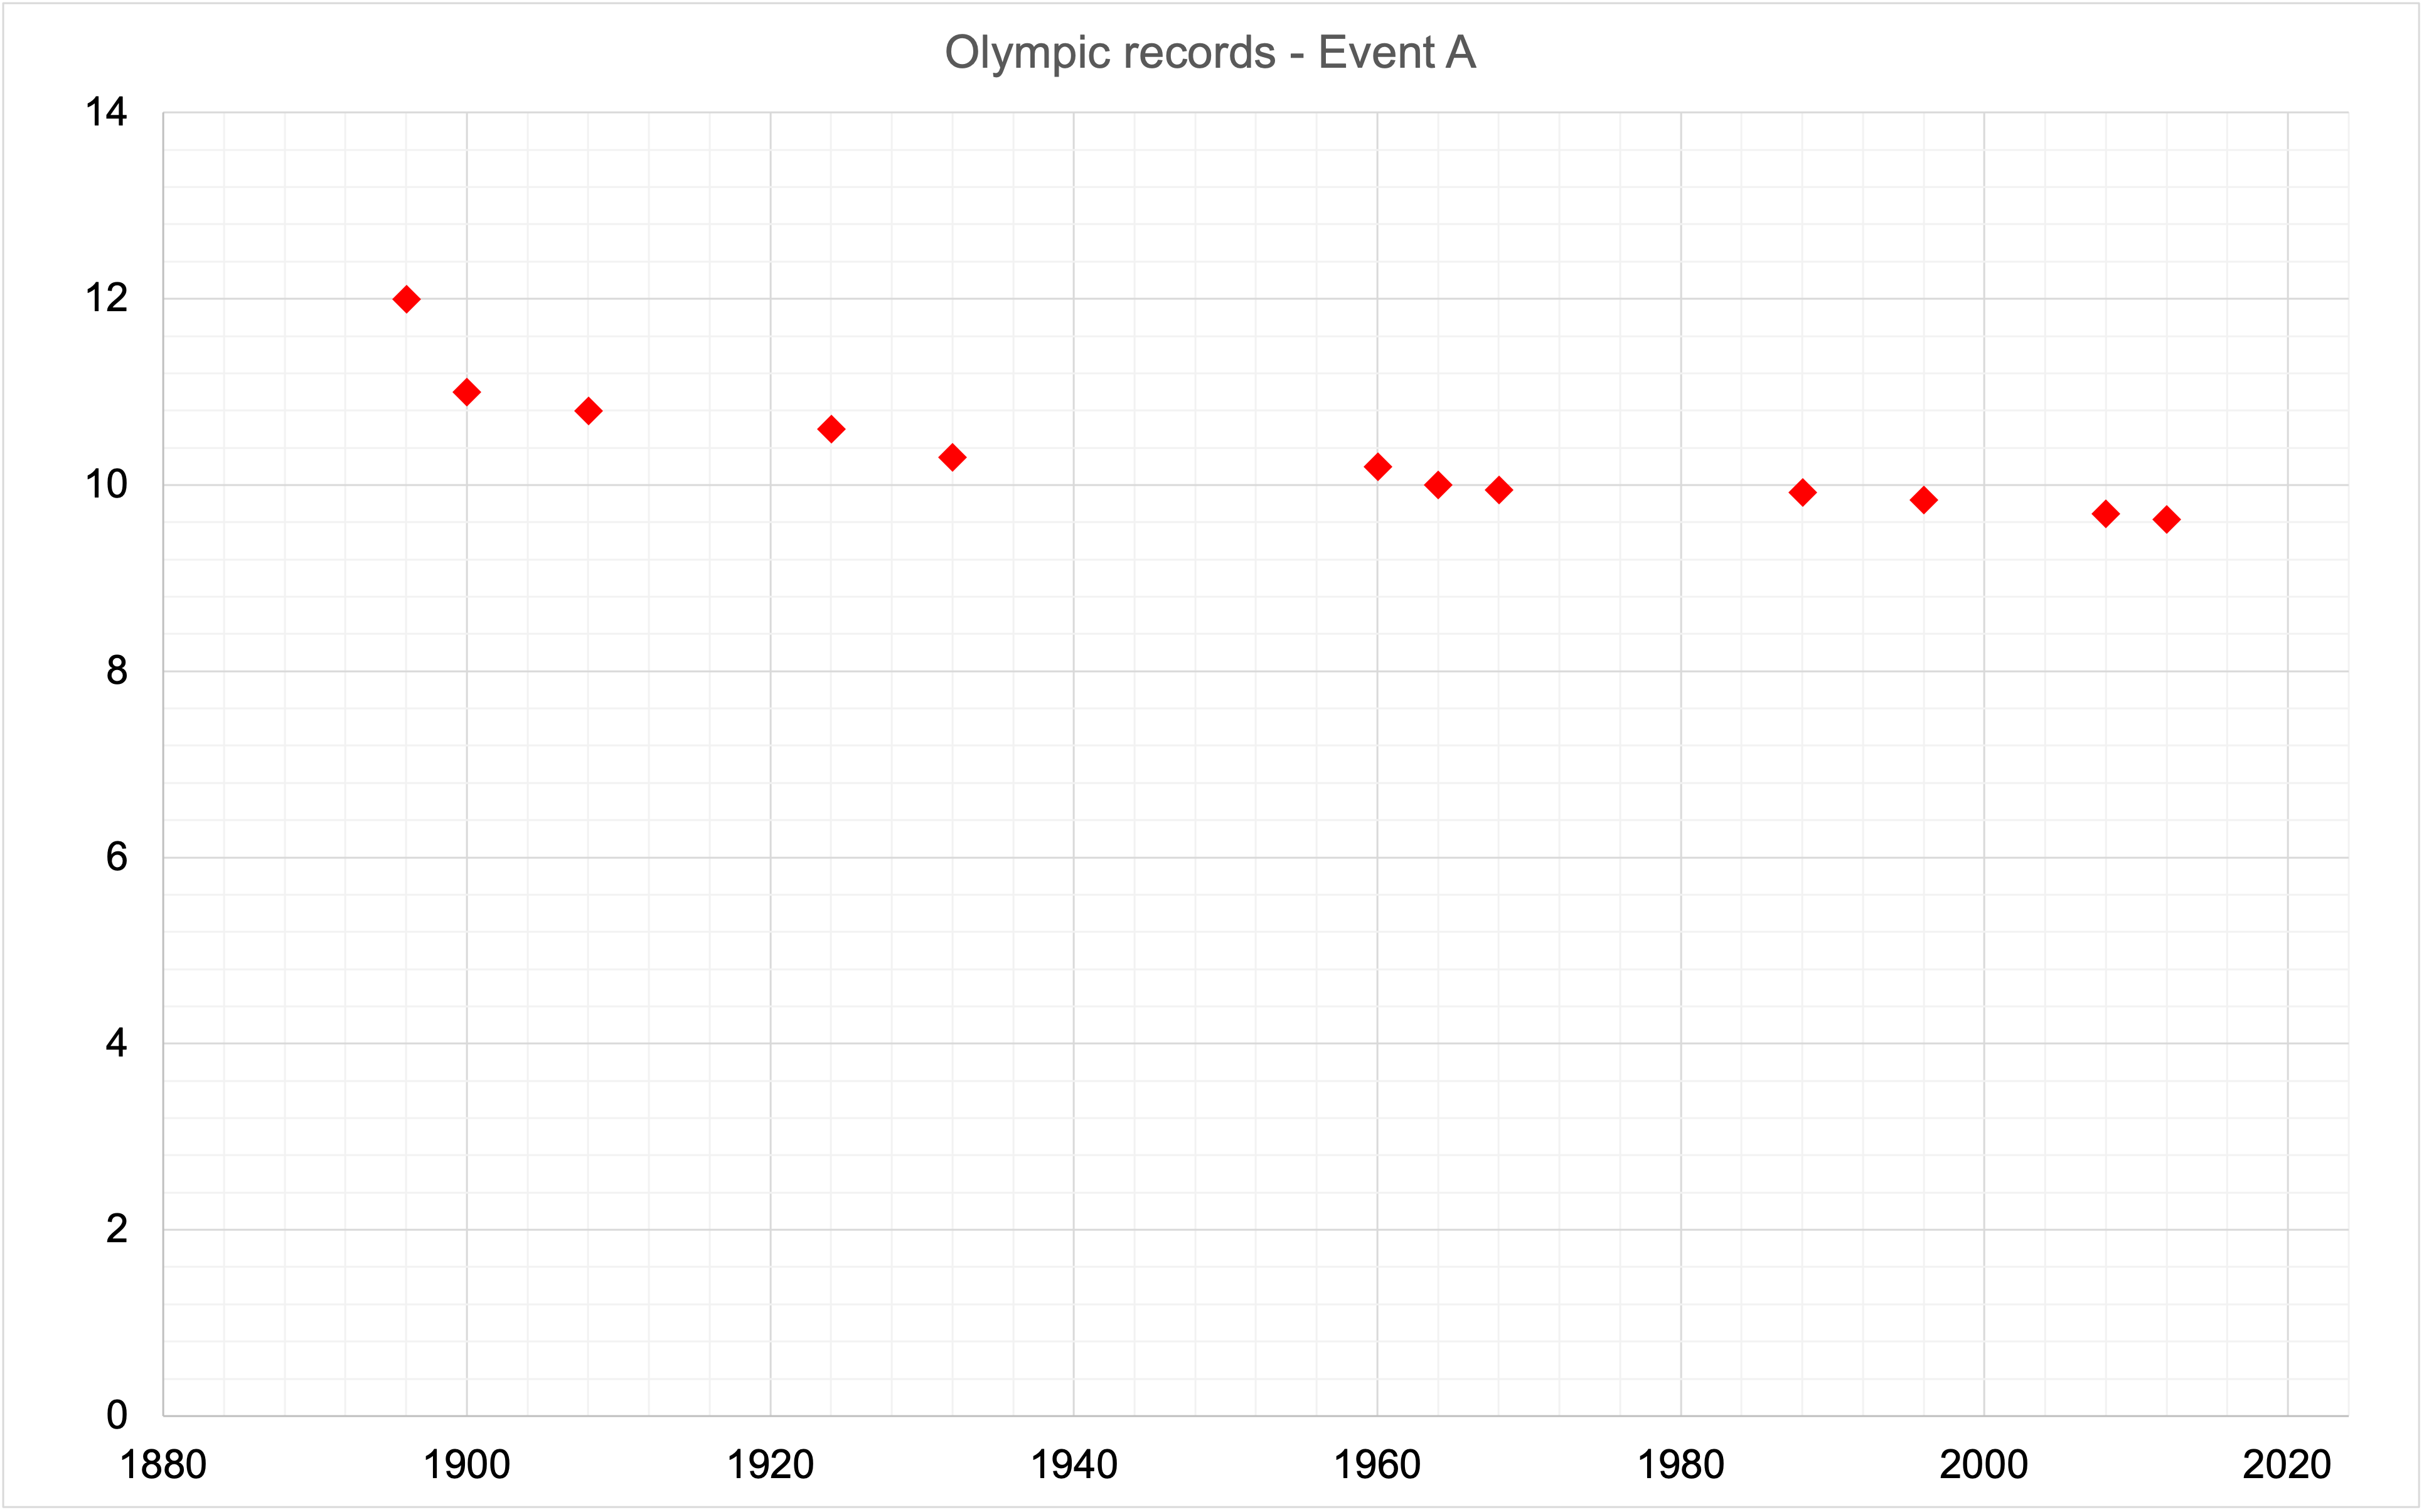
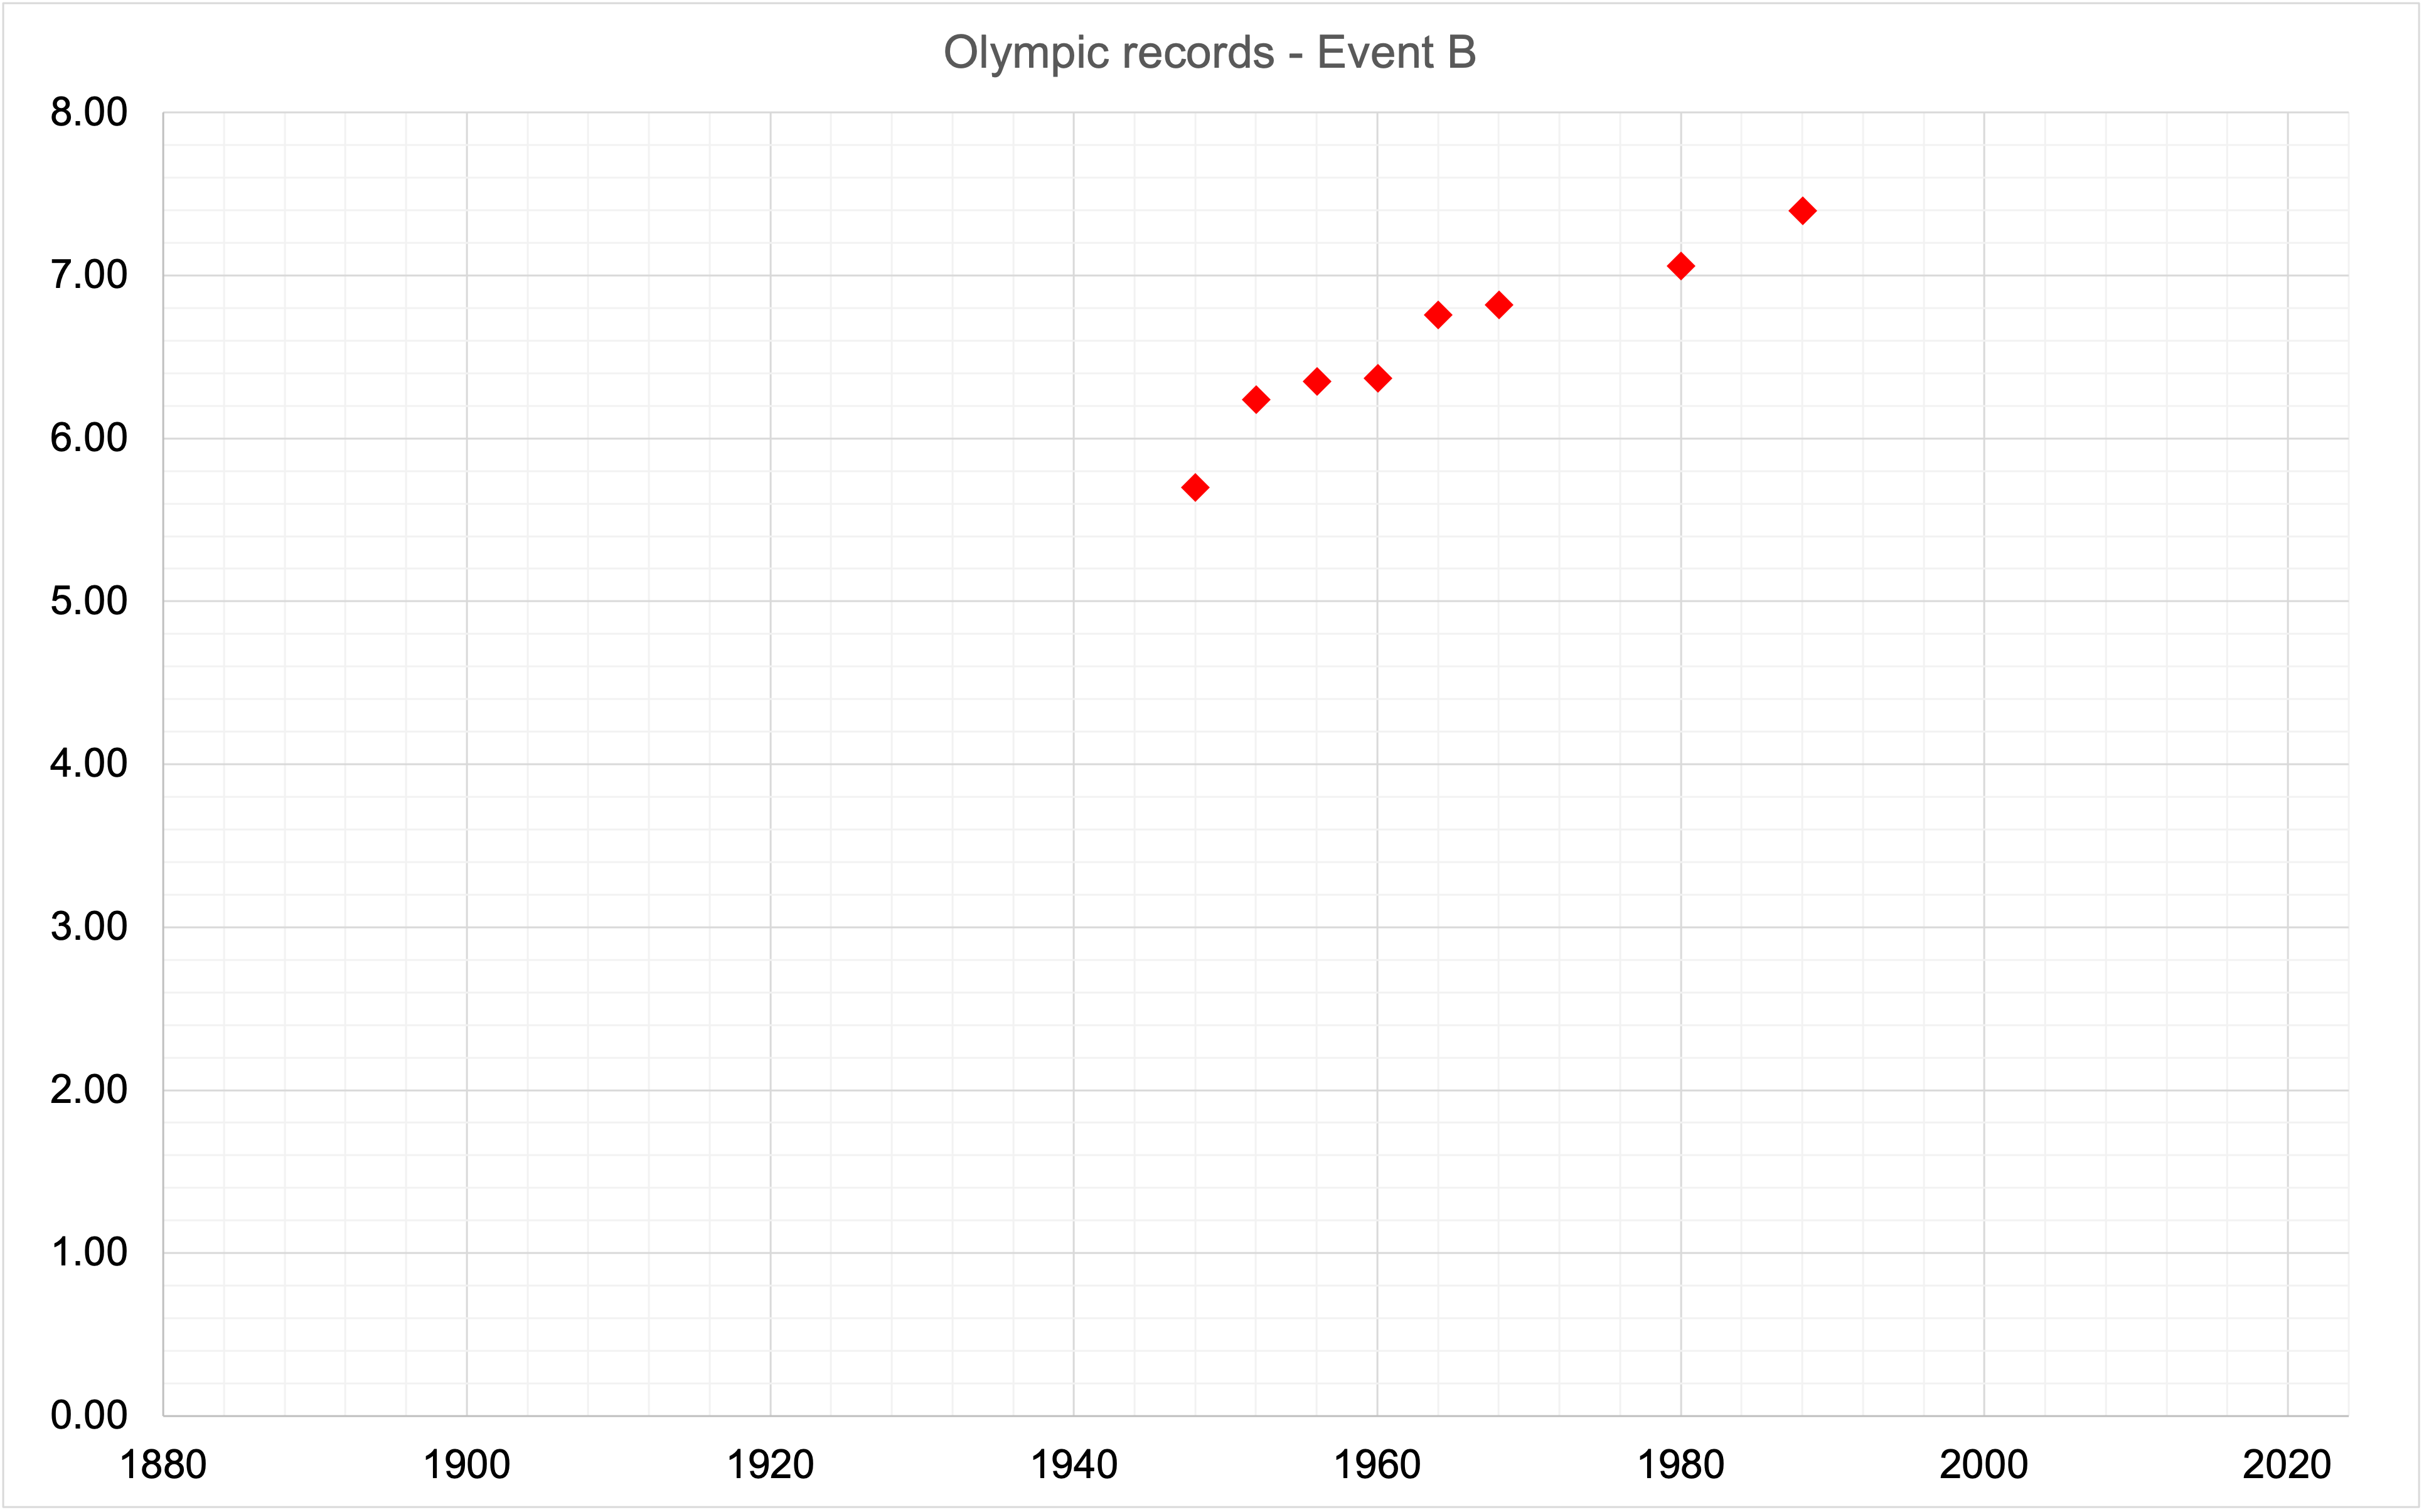
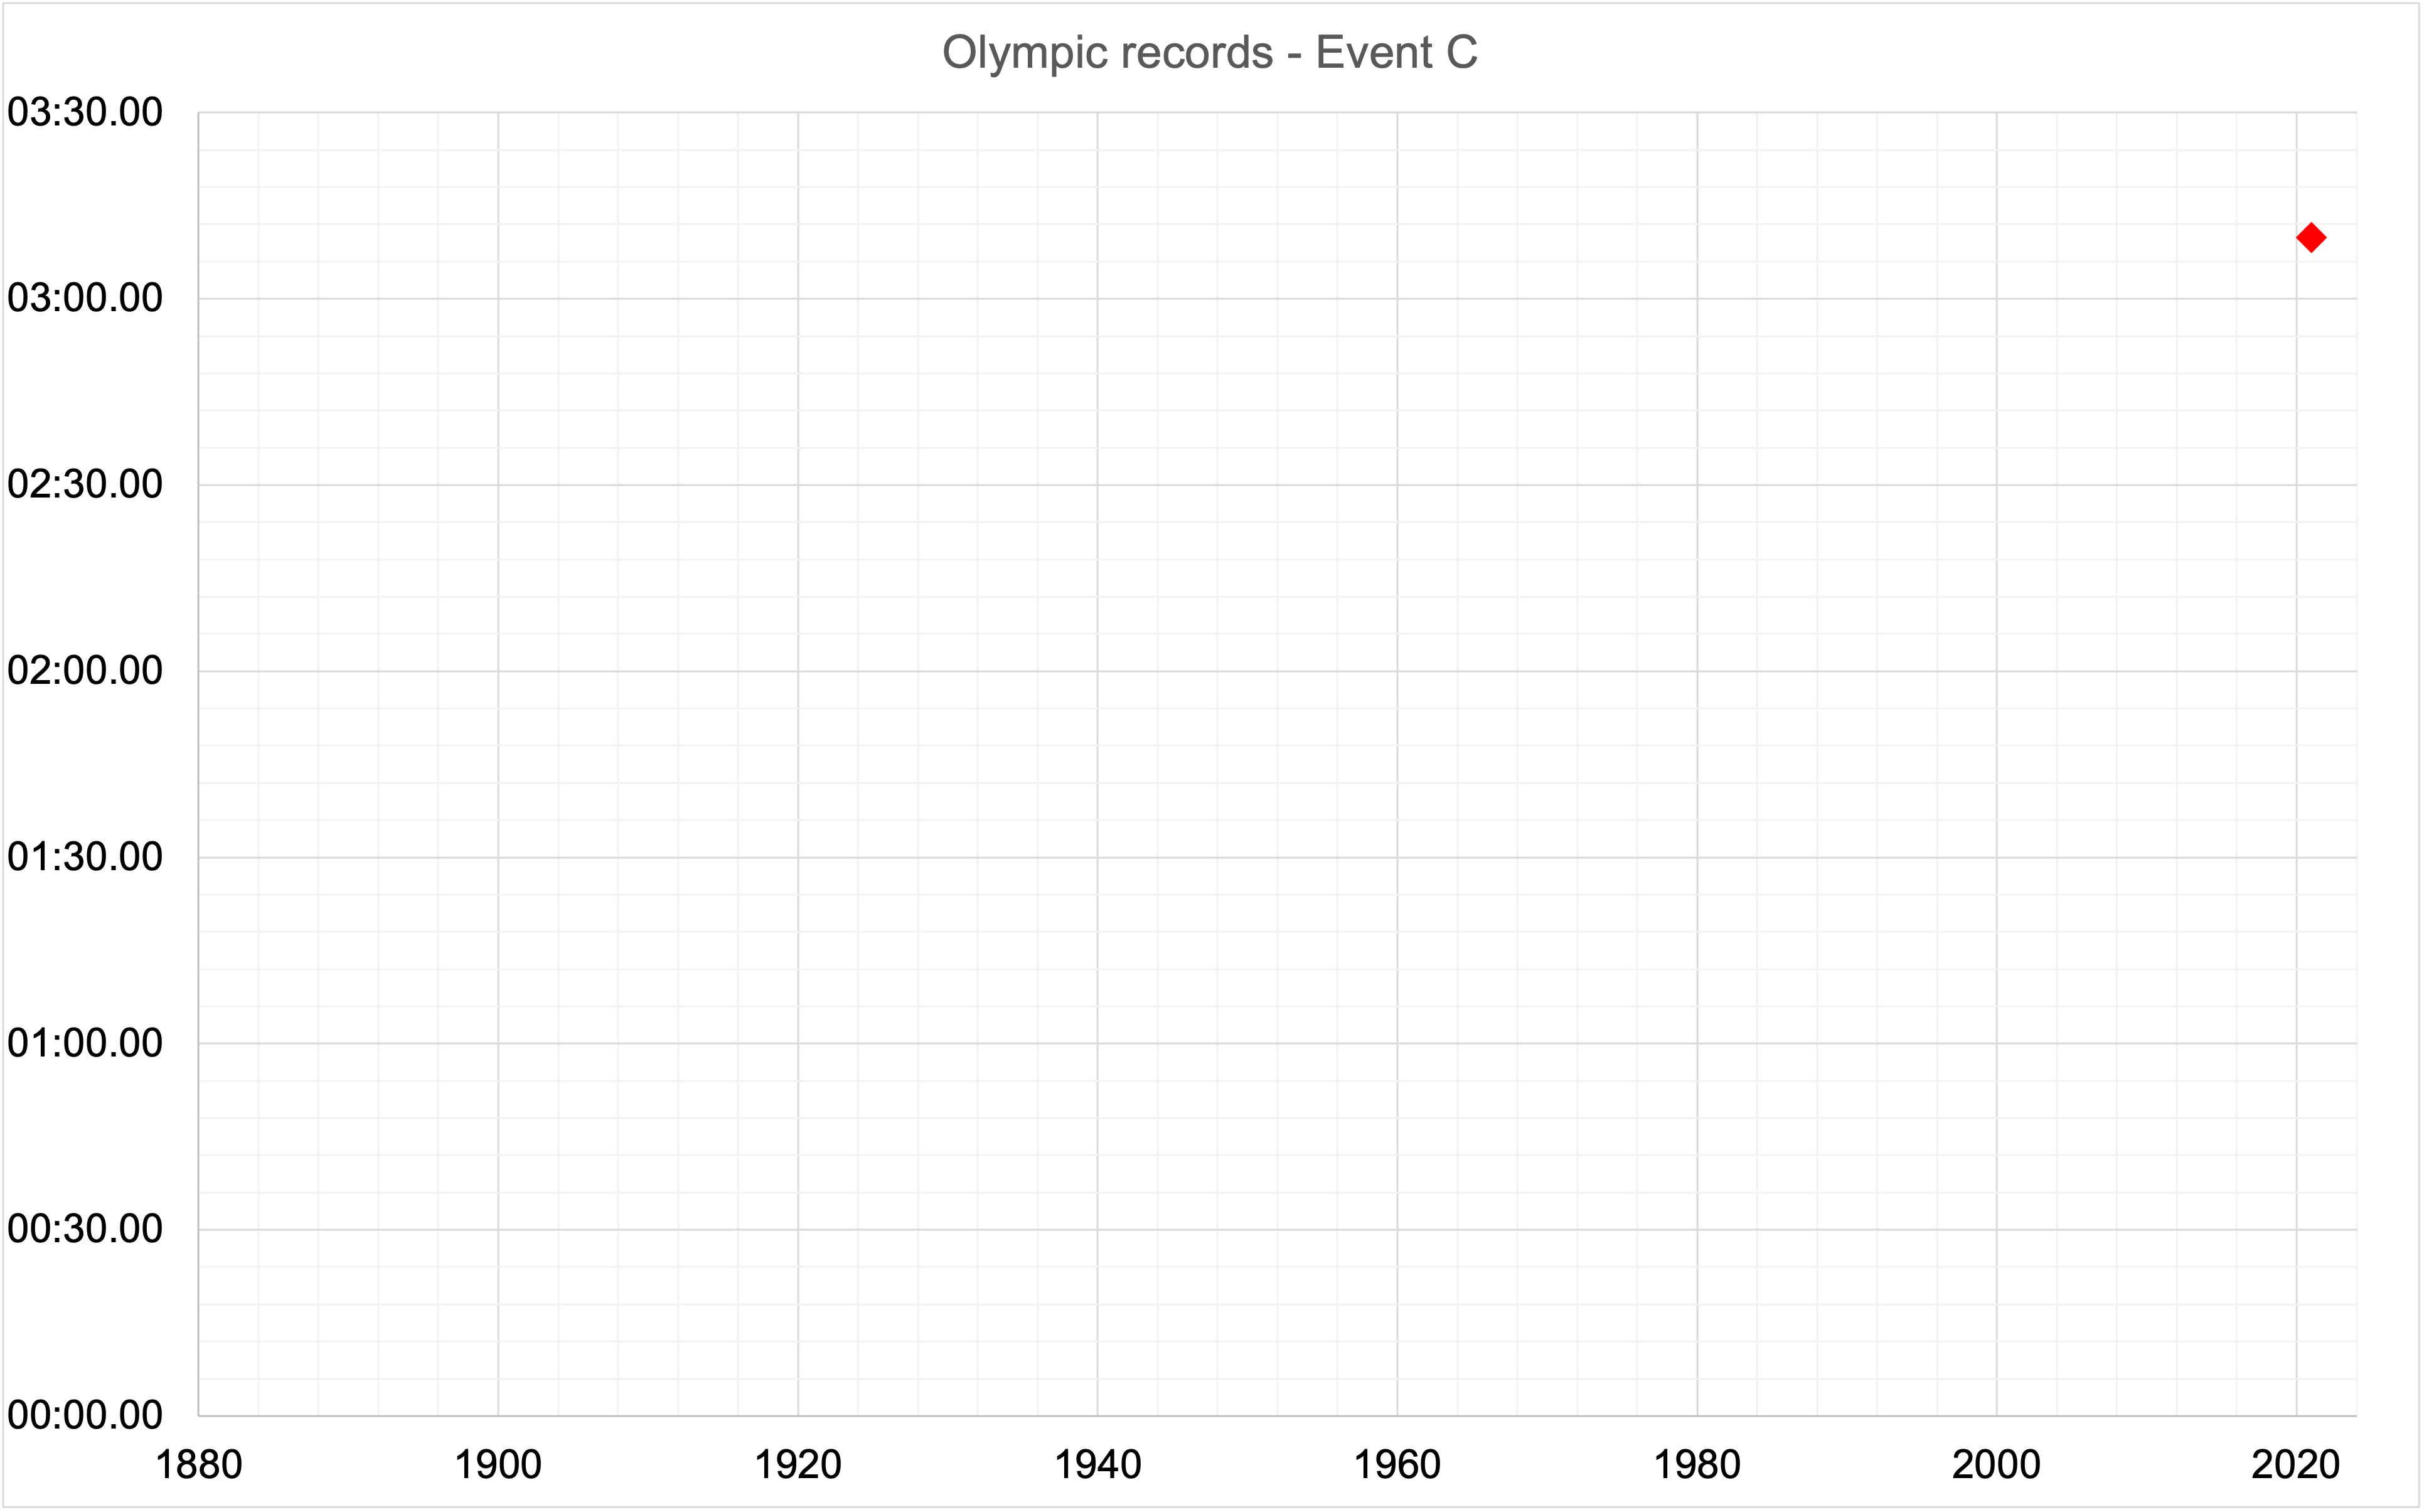
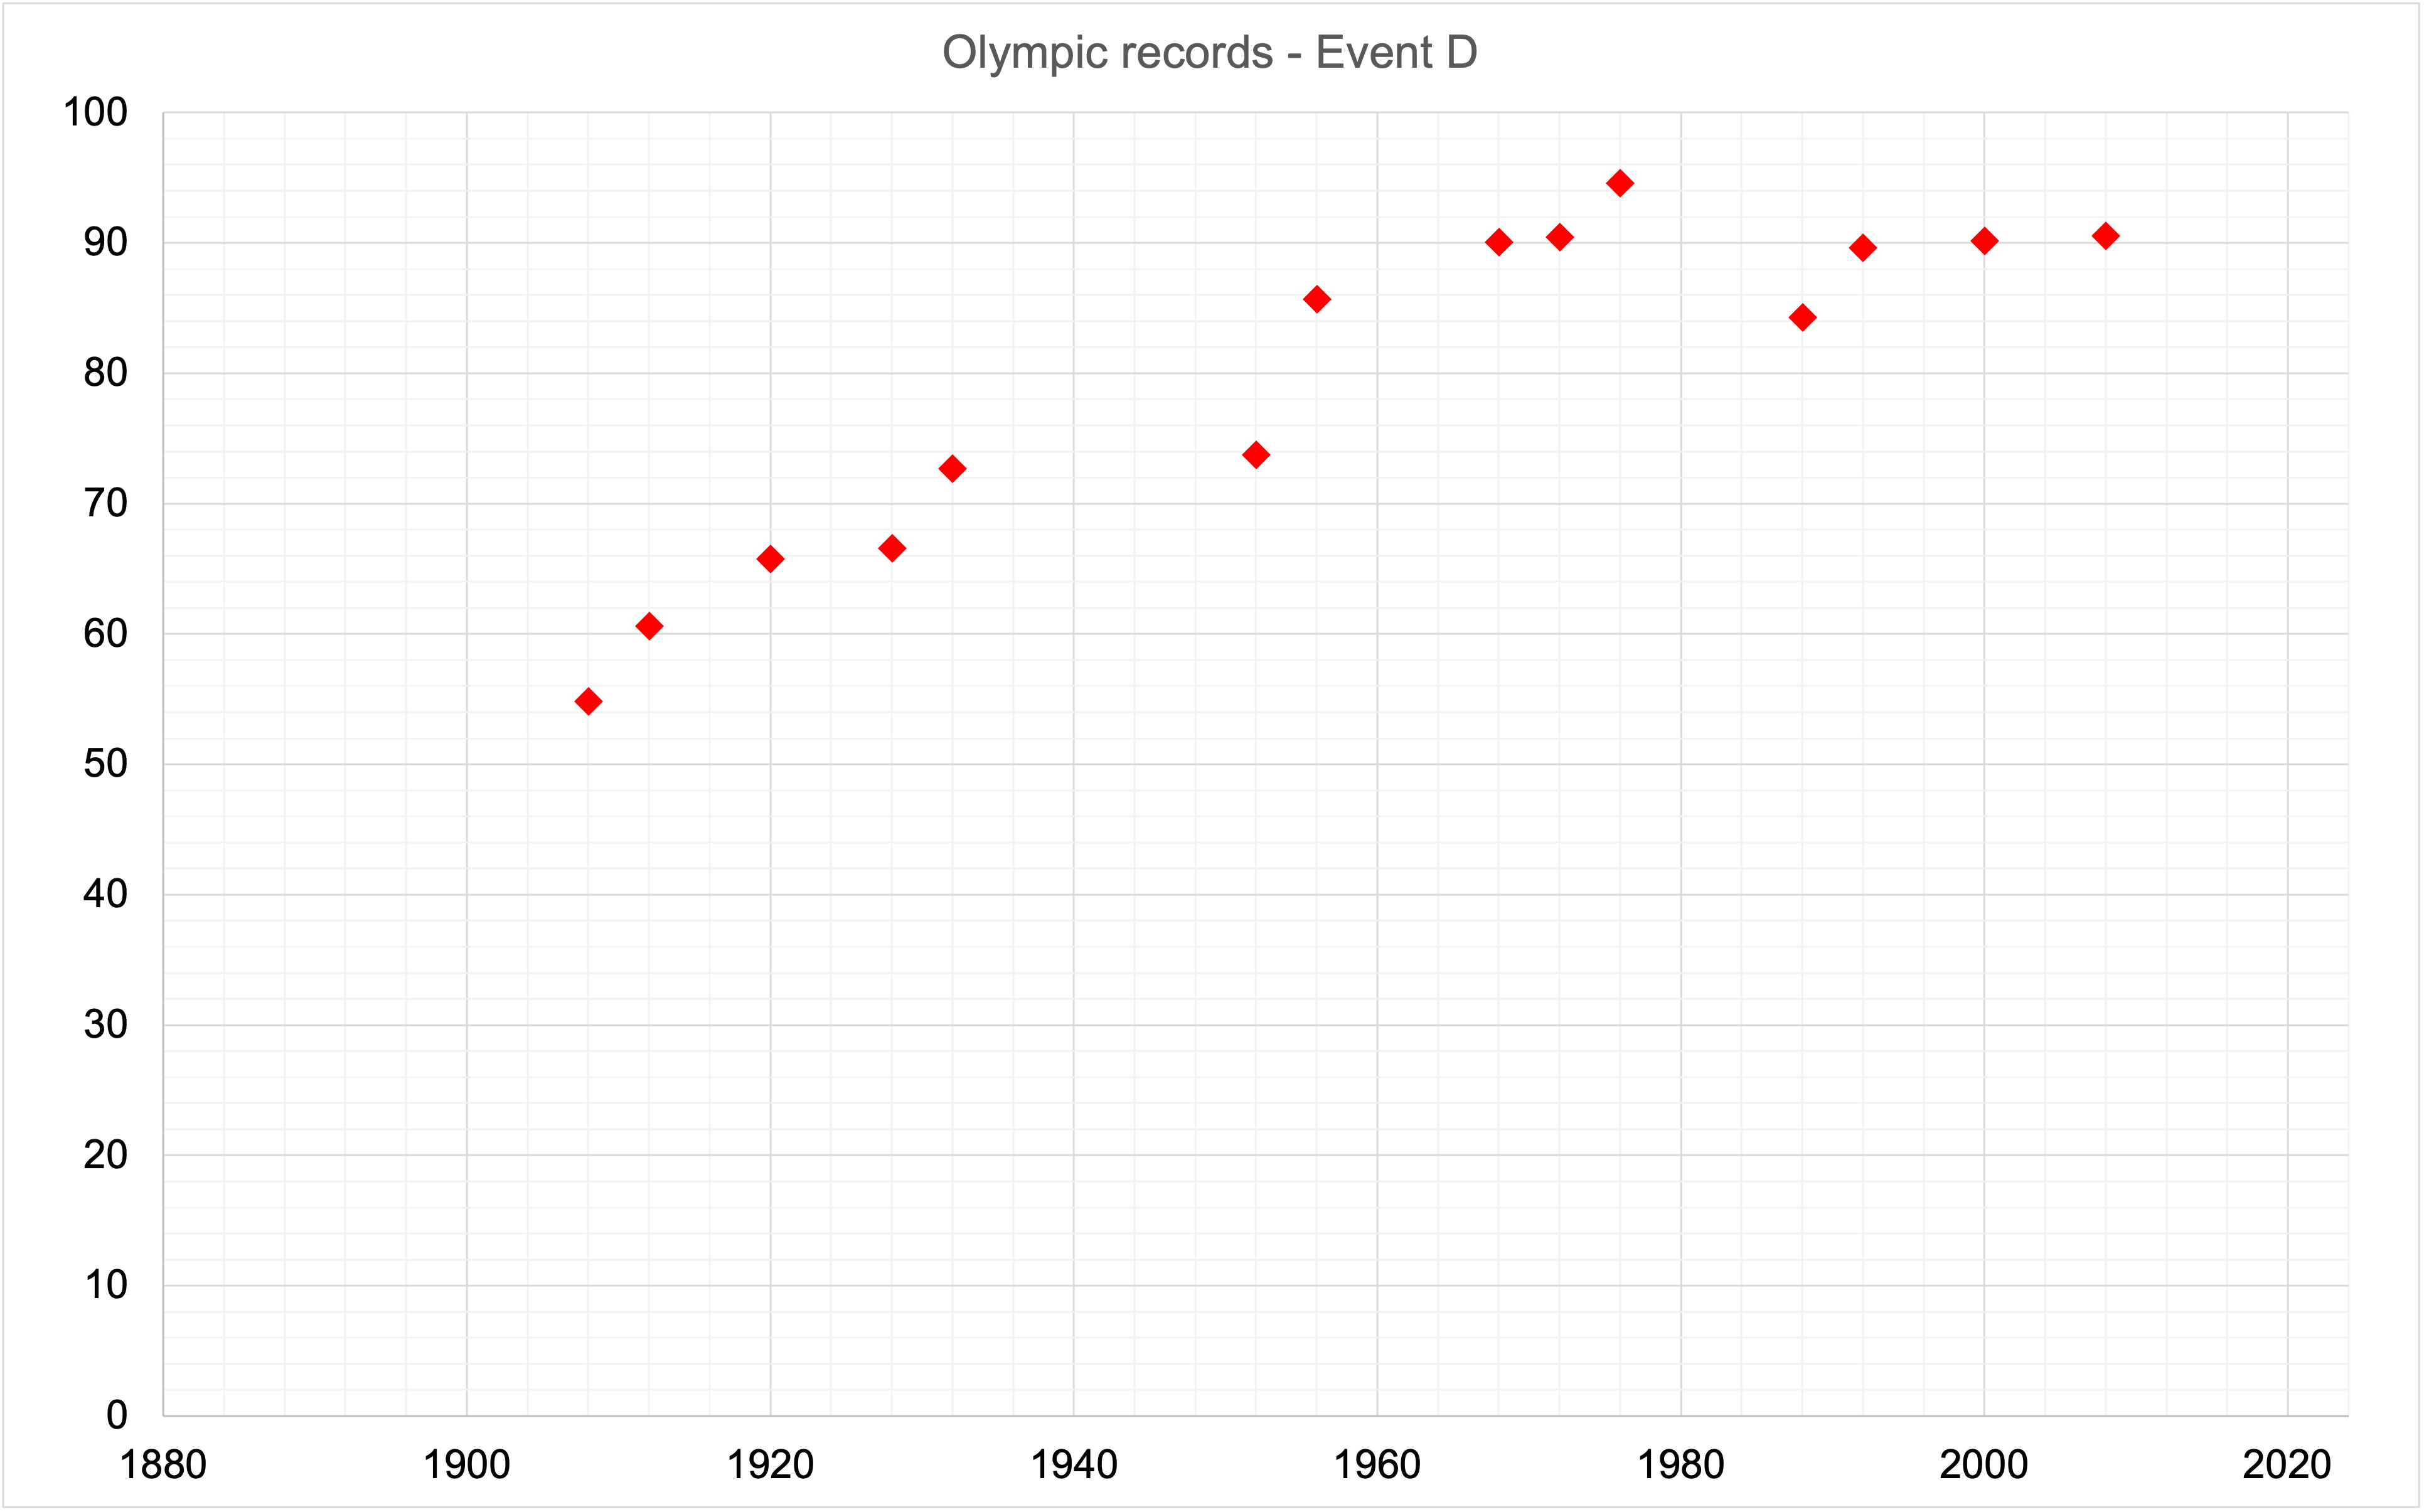
Thinking about these questions might help you get started:
Why do some of the graphs show the records increasing (going up) and on others the records decrease (go down)?
The horizontal (bottom) axis of each graph shows the dates of the Olympic Games. The units of measurement on the vertical axis are deliberately not labelled - can you work out what they could be?
What can you tell from the dates when the records start and stop?
Can you see any other interesting information from the graphs? Can you do some research to find out more?
This challenge is based on an activity first developed by our NRICH colleagues for the MMP's 'Maths and Sport: Countdown to the Games' initiative for the London 2012 Olympic and Paralympic Games, which was a partner project in the London 2012 Get Set+ education programme, and was awarded the London 2012 Inspire Mark. Thank you to everyone involved across the MMP and to Alan Parr for originally suggesting the idea. You can find more of our free mathematics resources on NRICH and Plus.